棒グラフをプロット
棒グラフをプロットしたい時は、ラインスタイルに boxes を指定します。
範囲とボックスの幅を指定しない場合は、隣のボックスとくっつくように表示されます。
plot 'test.dat' with boxes1 10
2 30
3 25
4 40
5 20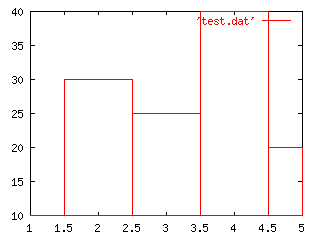
範囲を指定しないと、上のように見にくいグラフになってしまうので、棒グラフを表示する場合は範囲指定を行うか、マージンなどを設定するとよいです。
plot [0:6] [0:50] 'test.dat' with boxesset yrange [0:]
set offset 1, 1, 1, 0 # left, right, top, bottom の順 (後ろの方は省略できる)
plot 'test.dat' with boxes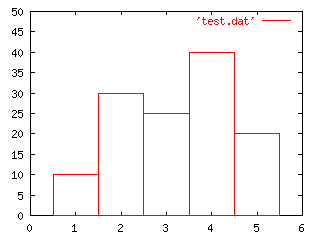
ボックスの幅を指定する
set boxwidth <width>   # ボックスの幅を指定
set boxwidth # ボックスの幅を自動調整に戻すset boxwidth 0.7
plot [0:6] [0:50] 'test.dat' with boxes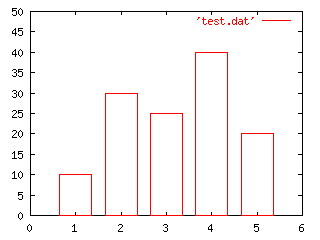
さらに、with lines で線を引いてやれば度数分布多角形を表示することができます。
replot 'test.dat' with lines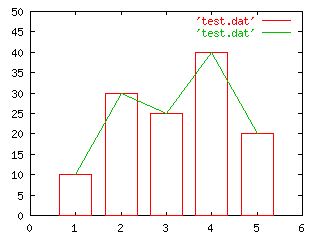
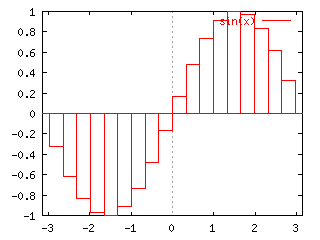
関数の棒グラフ表示
関数を棒グラフ表示することもできます (あんまり使い道ないかもしれないけど^^)。
plot [-pi:pi] sin(x) with boxes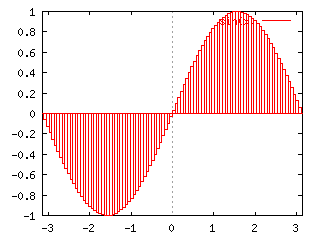
関数の棒グラフのボックス幅を変更する場合は、次のようにしてサンプル数を変更してやります(サンプル数のデフォルトは 100)。 ボックス間の隙間を開けることはできないみたいです(たぶん)。
set samples 20
plot [-pi:pi] sin(x) with boxes